The economic indicators for the year 2020 decreased compared to the previous year’s 2018-2019 because of the epidemic. A decrease is noticed in GDP, GDP per capita , and also exports and imports.
Palestinian Economic Indicators 2018-2020
|
Economic Indicator |
2018 |
2019 |
2020 |
|
Labor Force (million) |
1,382 |
1,357 |
1,291 |
|
Inflation% |
-0.19 |
1.37 |
-0.73 |
|
GDP(million$) |
15,616.2 |
15,829.0 |
14,037.4 |
|
GDP/Capita($) |
3,417.7 |
3,378.3 |
2,922.5 |
|
Unemployment% |
30.8 |
25.4 |
25.9 |
|
Exports(million$) |
1,155.6 |
1,103.8 |
1,056.6 |
|
Imports(million$) |
6,539.5 |
6,613.3 |
6,063.4 |
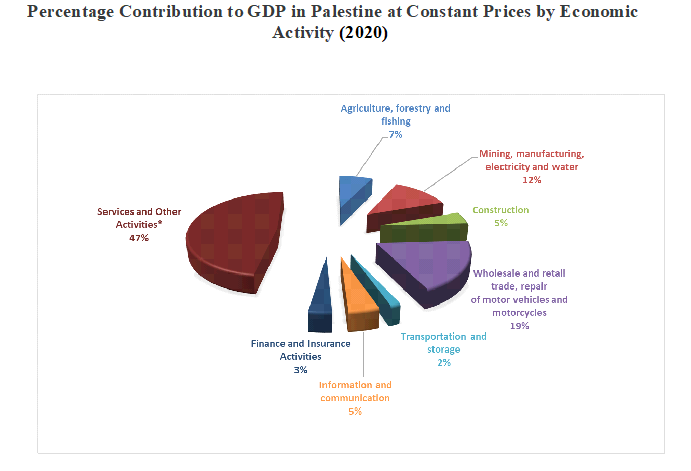
Percentage Contribution to GDP in Palestine at Constant Prices by Economic Activity (2020)
|
Economic Activity |
Valuable contribution |
Contribution rate |
|
Agriculture, forestry and fishing |
1,001.0 |
7 |
|
Mining, manufacturing, electricity and water |
1,744.4 |
12 |
|
Construction |
644.4 |
5 |
|
Wholesale and retail trade, repair of motor vehicles and motorcycles |
2,644.6 |
19 |
|
Transportation and storage |
221.9 |
2 |
|
Information and communication |
484.2 |
3 |
|
Finance and Insurance Activities |
639.7 |
5 |
|
Services and Other Activities* |
6,657.2 |
47 |
|
GDP |
14,037.4 |
100.0 |
- Other services: Other Service Activities Public administration and defense Households with employed persons


